Quantix: a market-data terminal built around the investor
A financial data company wanted everyday investors to get serious market data, simply and cheaply. We turned raw data feeds into a terminal people can search, compare and download, with an AI assistant that answers from the same data.
- Stocks
- ETFs
- Mutual funds
- Indices
- Screener
- Economic calendar
- Macro by country
- World markets
- AI assistant
- Files
- Stock exchanges
- Central banks
- Forex centres
- Light and dark themes
Using the fundamentals on this terminal, ACME's debt level sits below the sector median.
Open Fundamentals to see the figures behind it, or ask me to compare another company.
What did BetterAI build for Quantix?
A market-data terminal where an investor can look up any stock, ETF, fund or index, use a screener, check the economic calendar and macro data by country, see world markets on a 3D globe and ask an AI assistant questions answered from the same data.
What problem did Quantix solve?
The client wanted to make financial data accessible to anyone, as cheaply and simply as possible. The data arrived as raw feeds from a market-data provider, millions of rows with no way for a person to browse them. It needed a front end to search, compare and download.
What we built
Six parts, one terminal.
Any ticker, one page.
Widgets for stocks, ETFs, mutual funds and indices. Open a ticker and see everything about it in one place.
- Overview
- FundamentalsRevenue, margins, debt
- Technical indicators
- EarningsReports and history
- Analyst ratings
- ESG scores
- News
World markets on a spinning globe.
Stock exchanges, central banks and forex centres, joined by connection lines. Light and dark themes.
Ask the data, get an answer.
A short chat memory that expires after 20 minutes.
Download data sets, by membership.
Basic, pro, expert and master levels.
Filter by country, exchange, sector and industry.
A main screener with loose and extended versions, so a beginner and a power user both get what they need.
Pick a country, pick an indicator.
An economic calendar, plus a macroeconomics view that charts a series for any country you choose.
How does raw market data become a terminal?
Data comes from a provider's API into our own database, where it is cleaned and sorted. A back end serves it to the terminal screens. Heavy requests are stored locally instead of fetched again, which keeps screens fast and provider calls low. The assistant gets your question plus the relevant data.
- Provider feedRaw data through an API
- Our databaseStored, not re-fetched
- Cleaned and sortedReady to search
- Served by the back endLaravel, to the screens
- Terminal screensVue.js and Bootstrap
- Assistant answersQuestion plus data, streamed back
Inside the terminal
Six of the views. Keep scrolling to see more.
Stock, ETF, fund and index pagesOverview, fundamentals, indicators, ratings, ESG
ScreenerCountry, exchange, sector and industry filters
Economic calendarWhat is released, and when
Macro by countryOne indicator, one country, the whole series
World markets globeExchanges, central banks and forex centres
File managerData sets in folders, by membership level
Which technologies did we use?
A Laravel back end with a Vue.js and Bootstrap front end, our own database for the market data, a small Flask service for the AI assistant, and a WebGL map for the 3D globe, fed by coordinate files for exchanges, central banks and forex centres.
Questions about Quantix
Does Quantix trade money or give investment advice?
No. Quantix is a data and research tool. It shows market data and answers questions about it. Nothing in it is financial advice.
Where does the market data come from?
From a licensed market-data provider's API. We store the data in our own database, clean and sort it, and build the screens on top, so heavy requests are not fetched again and again.
Can you build a data terminal or dashboard for my business?
Yes. We build custom dashboards, data products and member portals on our own database and on the data feeds you already pay for. Book a free AI plan call and we will map what your users need to see.
Can you add an AI assistant to our data?
Yes. The assistant in Quantix answers questions from the company's data and forgets the chat after 20 minutes. We can set the memory and the sources to fit your rules.
 UpkeepOperations software, app and AI assistant
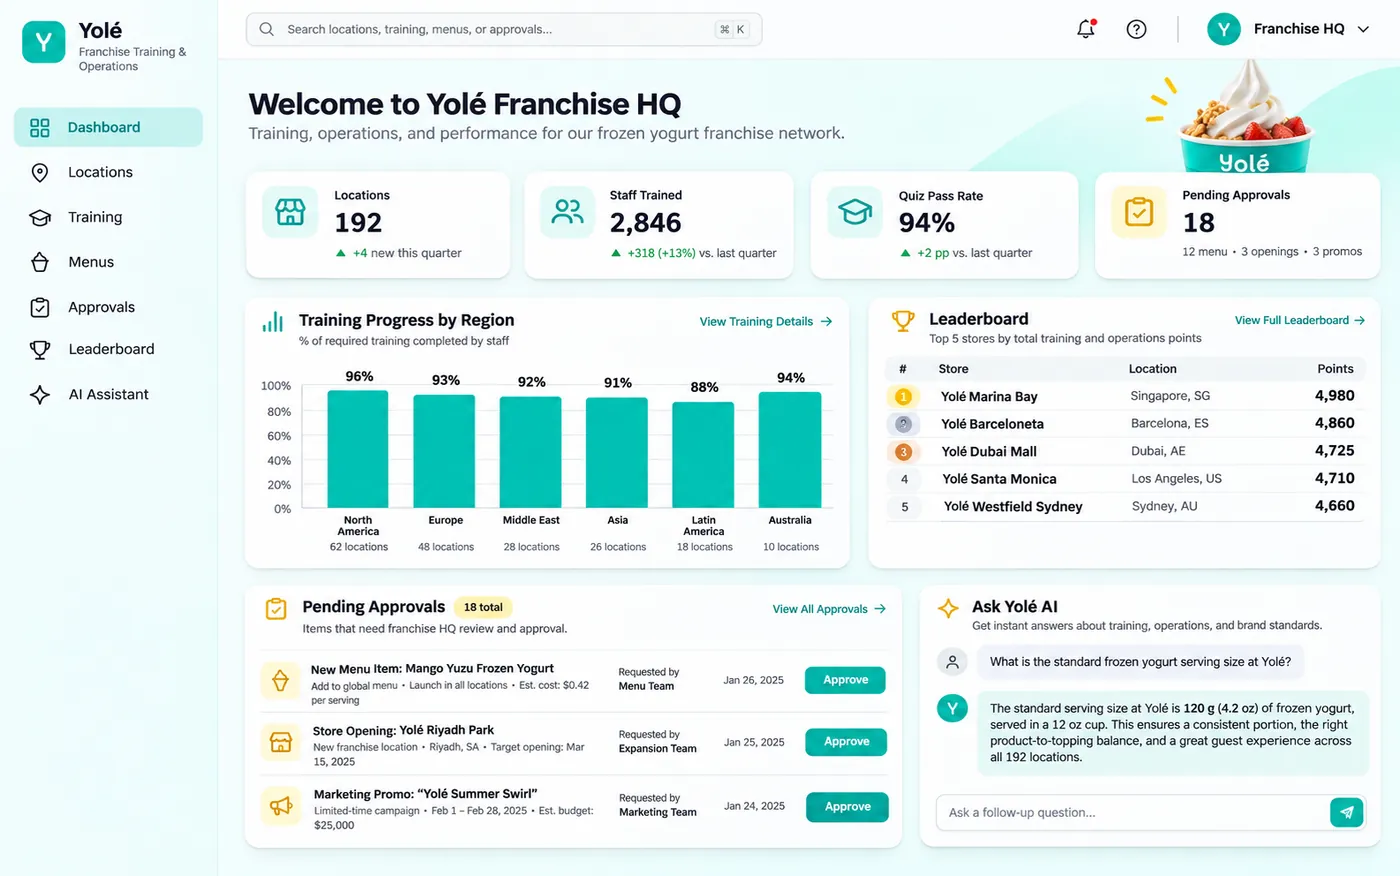 YoléFranchise operations and approvals
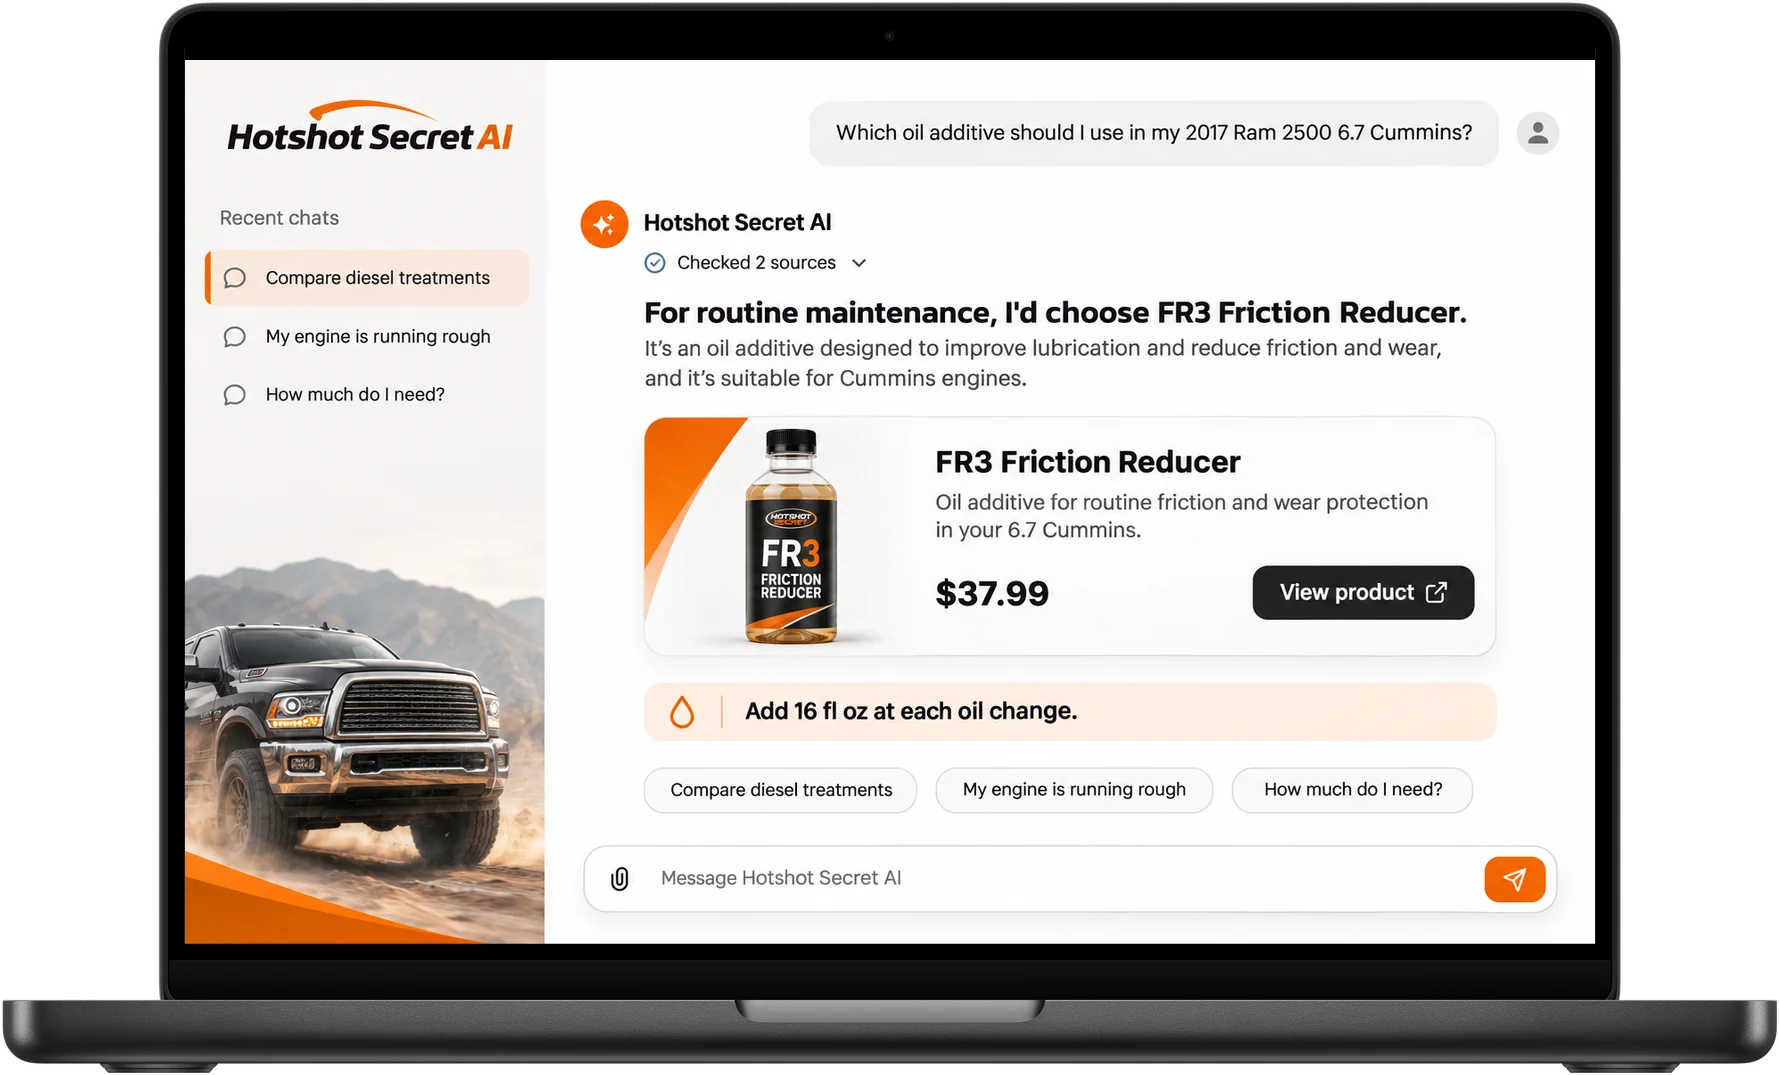 Hot Shot's SecretAI product expert
Want a data product like this?
Book a free call. Tell us what data you have and who needs to see it, and we will show you what to build first.
Build my project